Book summary
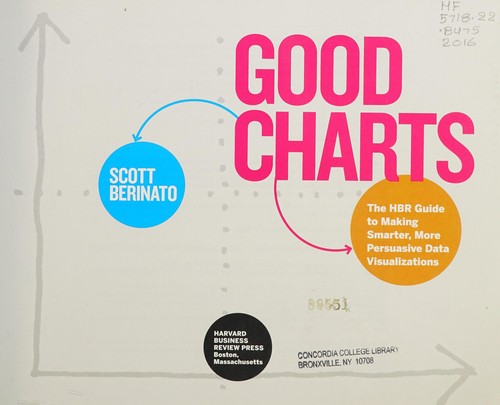
Good Charts by Scott Berinato is a practical guide to creating effective data visualizations that communicate ideas more powerfully than traditional spreadsheets or words alone. Berinato argues that dataviz has become an essential managerial skill in the era of abundant data and accessible tools, shifting from a specialist domain to a core competency for influencing decisions and gaining recognition. The book presents a systematic process of talking, sketching, and prototyping charts, grounded in research from visual perception, neuroscience, and visualization science to explain why certain designs evoke stronger cognitive and emotional responses. Ultimately, it teaches readers how to transform plain, generic charts into smart visualizations that convey meaning and persuade audiences.
Key founder lessons
-
1
Talk, sketch, then prototype
Founders should verbally articulate the idea first, sketch by hand to explore, and only then build in tools to create effective data visualizations.
-
2
Focus on the idea, not the data
Treat charts as idea-conveying tools rather than mere data displays to better persuade investors and teams about startup potential.
-
3
Choose chart types by message type
Match visualization form to whether the message is declarative, exploratory, or conceptual to communicate startup metrics clearly.
-
4
Leverage visual perception science
Use pre-attentive attributes like color and position to create intuitive charts that help stakeholders instantly grasp key insights.
-
5
Build visual literacy as a core skill
Treat dataviz as an essential managerial competency to stand out, influence decisions, and drive company success like early spreadsheet users.
Grok's review
Solid starter on visual thinking, padded with filler.
Good Charts does a credible job teaching founders how to move beyond Excel defaults and actually think about what their data is saying before they chart it. Berinato's talk-sketch-prototype process is genuinely useful and the neuroscience bits on why certain visuals land harder are interesting without being overly academic. The book shines when it forces you to interrogate the purpose of a chart instead of just making it pretty. Unfortunately it's padded with repetitive examples, case studies that feel like Harvard Business Review rejects, and advice that was already becoming dated by the time of publication; the evidence is often anecdotal rather than rigorous. Still worth skimming if you routinely embarrass yourself in board meetings with terrible slides, but don't treat it as gospel.
Best for: Founders who suck at data storytelling
Similar books
-

The Visual Display of Quantitative Information
Edward R. Tufte
Masterclass in data visualization principles that elevate business storytelling and decision-making.
-
Storytelling with Data
Cole Nussbaumer Knaflic
Practical guide to turning complex data into clear, persuasive narratives for leaders and teams.
-

Big Data at Work
Scott Tonidandel, Eden King
Shows how to leverage data and analytics for competitive advantage and smarter business decisions.
-
How to Measure Anything
Douglas W. Hubbard
Demystifies quantifying uncertainty and risk to improve strategic choices and productivity.
-

The McKinsey way
Ethan M. Rasiel
Reveals structured problem-solving and presentation techniques used by top consultants.
-
slide:ology
Nancy Duarte
Teaches design principles for creating impactful presentations that drive business results.
Founder activity
Nobody has shelved this yet
Be the first founder to add it.