
Book summary
The Visual Display of Quantitative Information by Edward R. Tufte is a foundational work on the effective design of statistical graphics, charts, and tables that emphasizes principles for presenting data with clarity, precision, and efficiency. Tufte introduces core concepts such as the data-ink ratio, which measures the proportion of ink used to convey actual information versus non-essential decoration, and advocates for maximizing data density through techniques like small multiples, high-resolution displays, time-series plots, relational graphics, and multivariate designs. The book analyzes hundreds of historical and contemporary examples, praising elegant solutions from pioneers like William Playfair while critiquing deceptive or cluttered graphics that distort data through design variation, excessive ornamentation, or poor editing. Its core argument is that good graphical design is fundamentally about clear thinking and ethical communication, treating visualization as a tool for truthful discovery and rapid understanding rather than mere decoration.
Key founder lessons
-
1
Maximize data-ink ratio
Founders should strip non-essential elements from pitch deck charts so every pixel directly represents data, enabling quicker investor comprehension.
-
2
Avoid chartjunk
Eliminate decorative graphics in metrics dashboards that distract from core signals, ensuring teams focus on real performance trends.
-
3
Use small multiples
Display series of similar charts side-by-side in product analytics to let users instantly compare patterns across cohorts or time periods.
-
4
Show multivariate data
Layer multiple variables into single visuals in market analysis reports to reveal complex relationships without overwhelming the viewer.
-
5
Detect graphical deception
Scrutinize competitor or internal reports for manipulated scales that exaggerate growth, then design truthful alternatives for transparent decision-making.
Grok's review
Timeless design bible, but pre-digital and preachy.
Tufte's classic is a masterclass in clarity and integrity for charts, graphs, and data presentation—his principles like maximizing data-ink ratio and avoiding chartjunk have shaped how every thoughtful founder thinks about dashboards, pitch decks, and metrics. The examples are exquisite, the scorn for bad graphics is deliciously opinionated, and it will make you embarrassed by half the visuals your team produces. Weaknesses: it's padded with repetitive examples, feels dated in a world of interactive dashboards and AI-generated charts, and the evidence is mostly aesthetic assertion rather than rigorous testing. Still worth a founder's time if you care about communicating numbers without lying.
Best for: Founders who obsess over metrics and storytelling
Similar books
-

The Functional Art
Alberto Cairo
Masterful guide to data visualization that sharpens analytical thinking for business decisions.
-
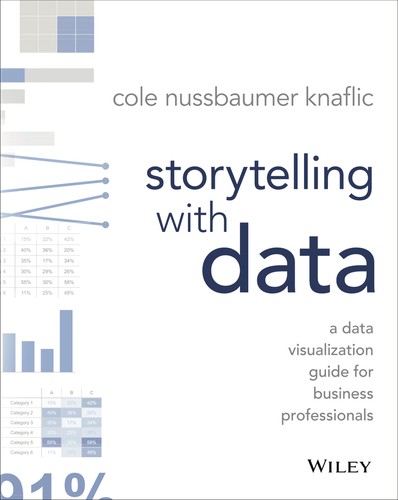
Storytelling with Data
Cole Nussbaumer Knaflic
Practical framework for turning complex data into compelling narratives that drive action.
-
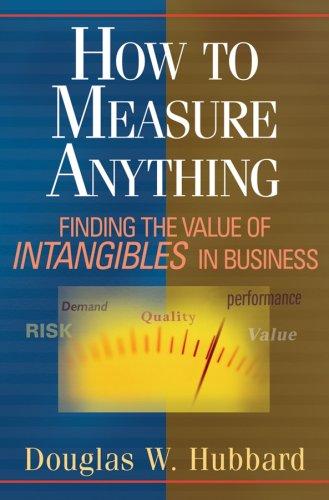
How to Measure Anything
Douglas W. Hubbard
Quantifies uncertainty and risk, essential for data-driven startup decisions.
-

Thinking, fast and slow
Daniel Kahneman
Reveals cognitive biases, improving founder judgment in strategy and hiring.
-
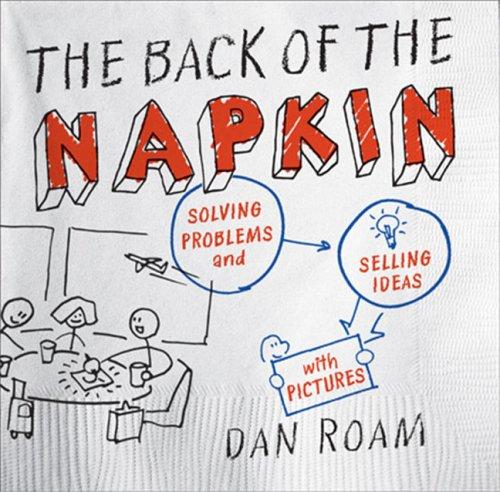
The Back of the Napkin
Dan Roam
Teaches visual thinking to solve problems and communicate ideas effectively.
-

Envisioning Information
Edward R. Tufte
Explores multidimensional data display, enhancing clarity in complex business contexts.
Founder activity
Nobody has shelved this yet
Be the first founder to add it.