
Book summary
How to Lie with Statistics by Darrell Huff is a classic guide to the many ways in which numbers are manipulated to mislead, whether through biased sampling, misleading graphs, confusing averages, or selective reporting of data. With illustrations by Irving Geis, the book walks readers through common statistical tricks used in advertising, politics, and the media to create false impressions of trends, correlations, and significance. Its core argument is that statistics are not inherently truthful but become powerful tools of deception when wielded without skepticism or proper context, and that basic awareness of these techniques is essential for anyone who consumes numerical information. Though first published in 1954, its lessons remain strikingly relevant today.
Key founder lessons
-
1
Question the Source and Agenda
Founders must scrutinize who funded the data, as the book shows biased sources often produce misleading statistics to support their interests.
-
2
Beware of Truncated Graphs
Examine y-axis scales in pitch decks and reports, since the book reveals how truncated graphs exaggerate trends to deceive investors and users.
-
3
Uncover Sample Bias
Validate that user metrics come from representative samples, as Huff details how non-random samples distort startup growth claims.
-
4
Spot the Missing Denominator
Always demand percentages include base numbers, per the book's examples, to avoid inflated success rates in marketing or A/B test results.
-
5
Detect Post-Hoc Fallacies
Distinguish correlation from causation in analytics, using the book's warnings to prevent misguided pivots based on spurious data links.
Grok's review
Still sharp on stats abuse, but feels padded and dated.
Huff's 1954 classic remains a delightfully snarky tour through the most common ways numbers are twisted to lie—cherry-picking, misleading graphs, confusing correlation with causation, and the rest. For startup founders drowning in pitch-deck metrics, cohort curves, and vanity KPIs, it's a quick vaccine against being fooled by your own data team or investors. What doesn't work is the thin, anecdotal evidence and repetitive padding that makes the book feel like a long magazine article stretched to 144 pages; the examples are charmingly mid-century and some advice (like hand-drawn charts) shows its age. Still worth the couple of hours because the core tricks haven't changed at all, but don't expect a modern playbook with rigorous studies or startup-specific cases.
Best for: Founders who want to spot BS in metrics and pitches
Similar books
-

Thinking, fast and slow
Daniel Kahneman
Reveals cognitive biases and statistical thinking pitfalls that inform better business decisions.
-

Fooled by randomness
Nassim Nicholas Taleb
Exposes how randomness and luck mislead success narratives in investing and startups.
-
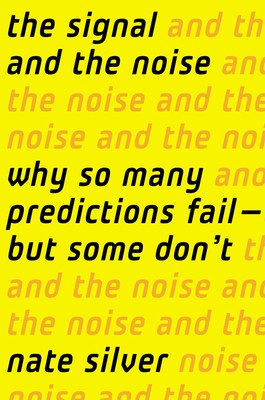
The Signal and the Noise
Nate Silver
Teaches probabilistic thinking and separating signal from noise for strategic forecasting.
-

Superforecasting
Philip E. Tetlock, Dan Gardner
Shows how to improve predictive accuracy, vital for founder decision-making under uncertainty.
-

Naked Statistics
Charles J. Wheelan
Demystifies stats with humor and real-world examples applicable to business metrics.
-

The art of thinking clearly
Rolf Dobelli, Rolf Dobelli
Catalogs cognitive errors with practical lessons to avoid in leadership and strategy.
Founder activity
Nobody has shelved this yet
Be the first founder to add it.